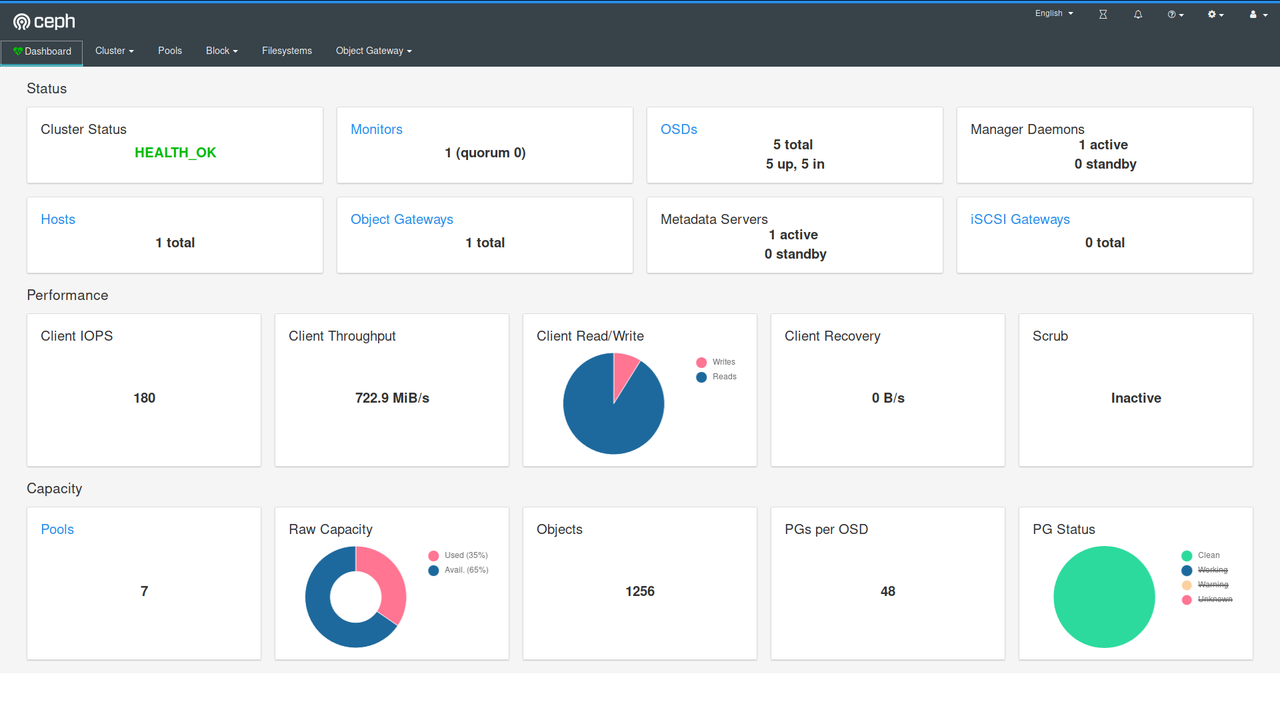
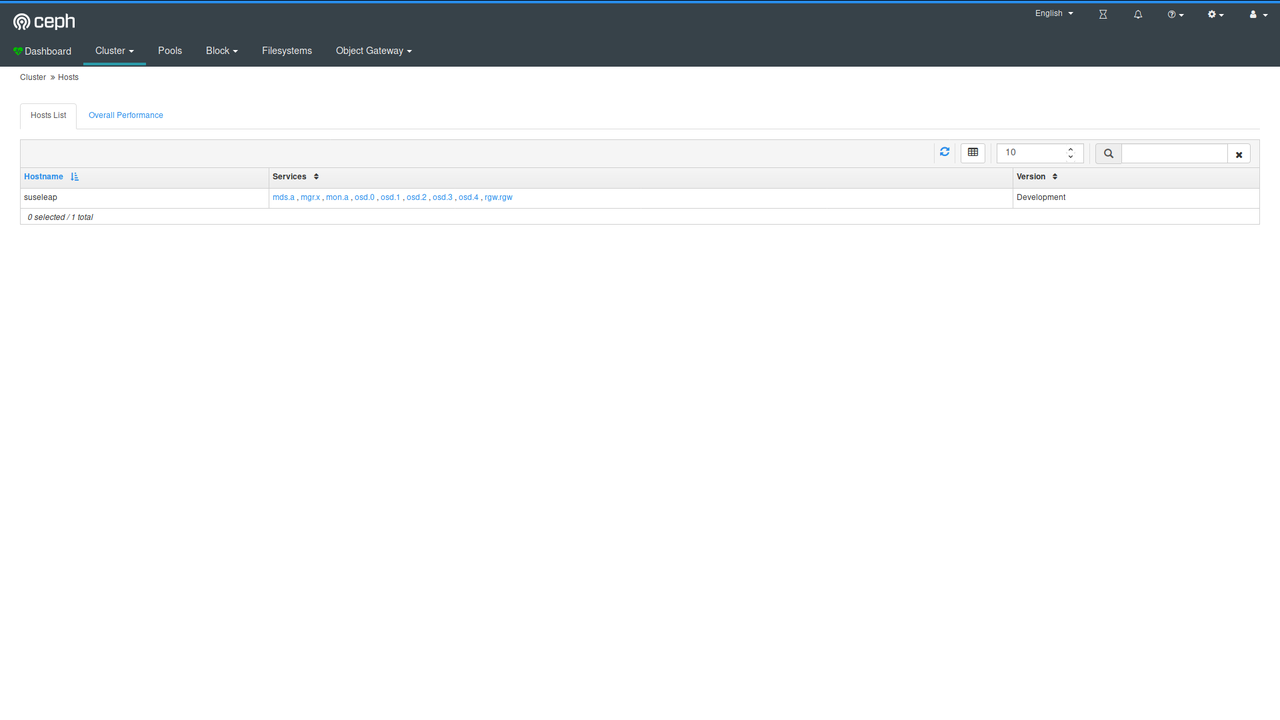
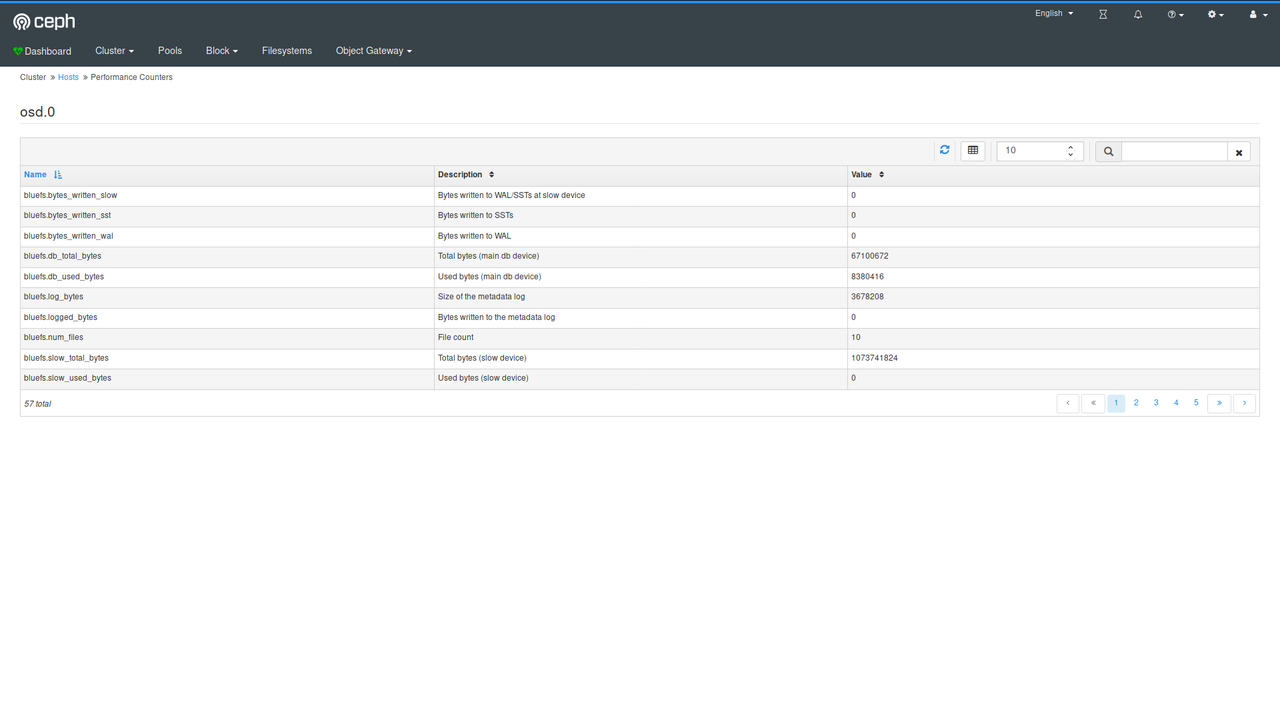
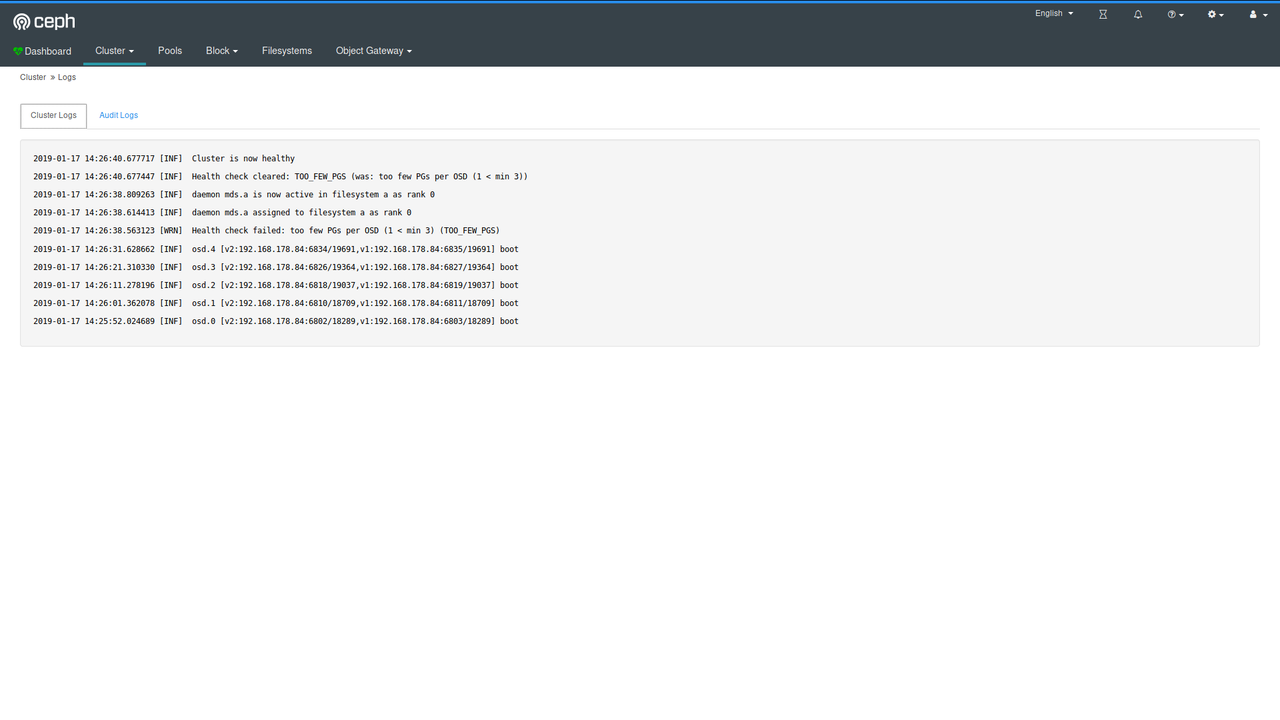
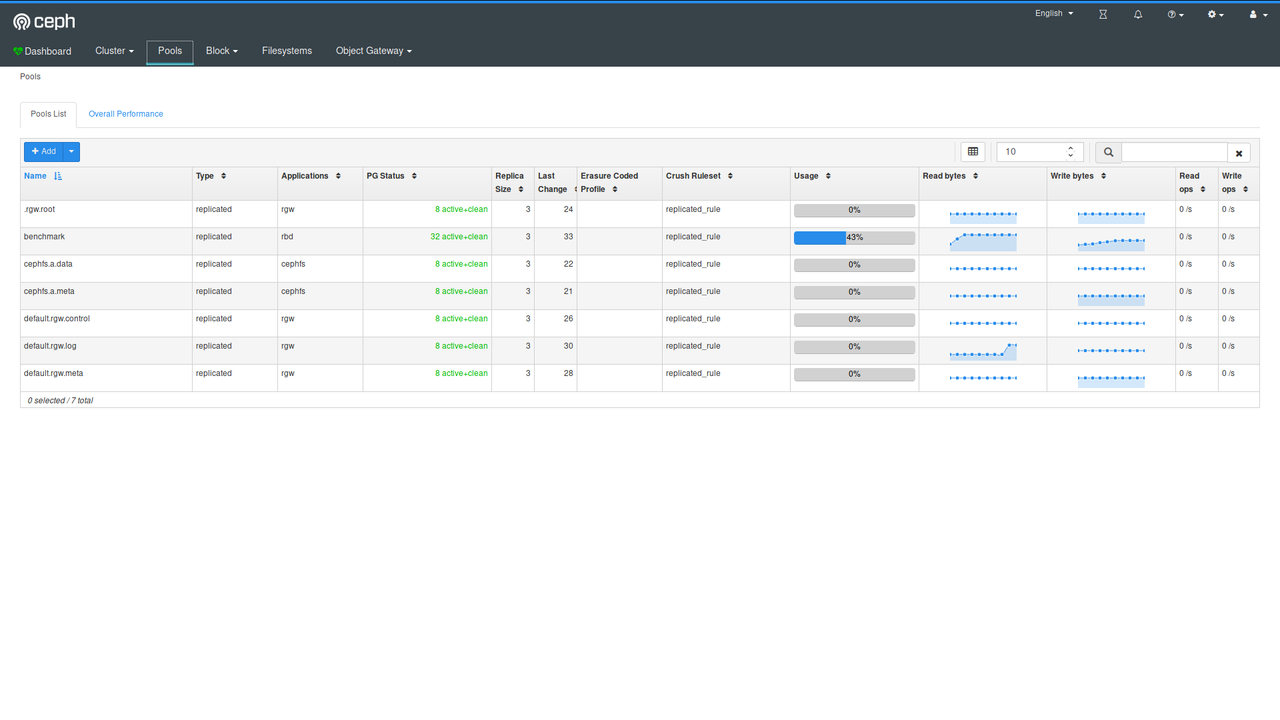
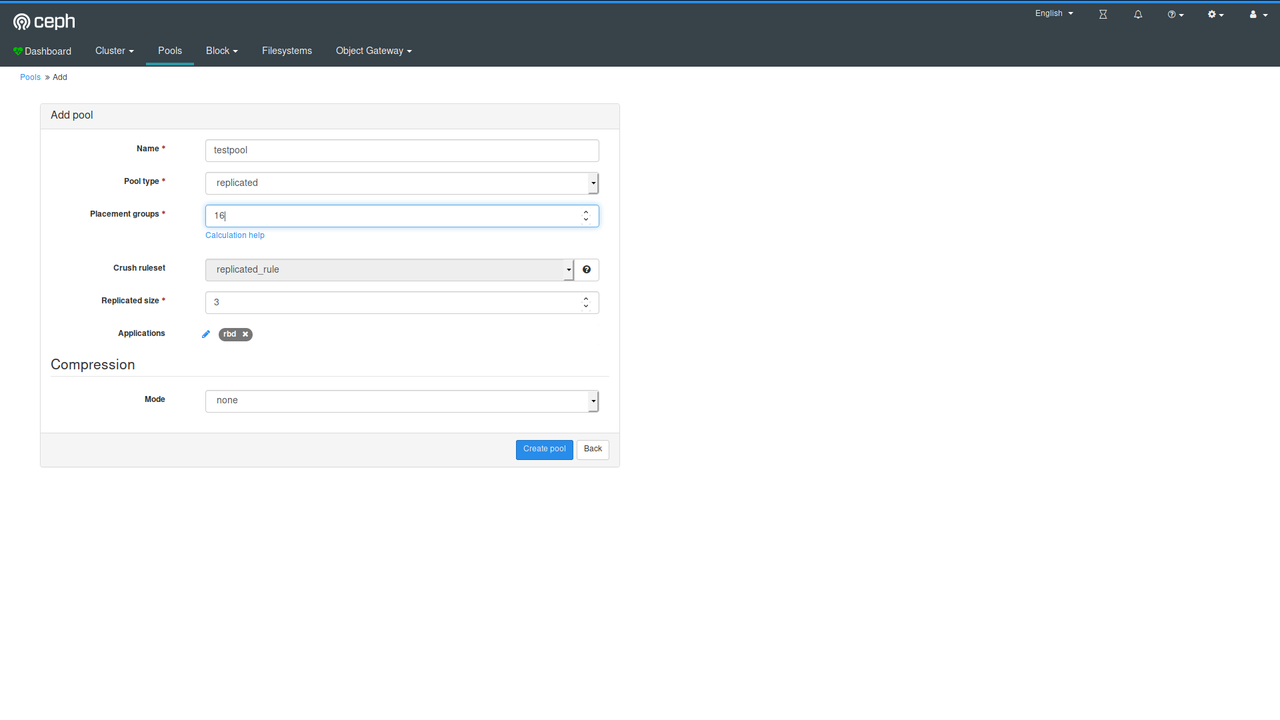
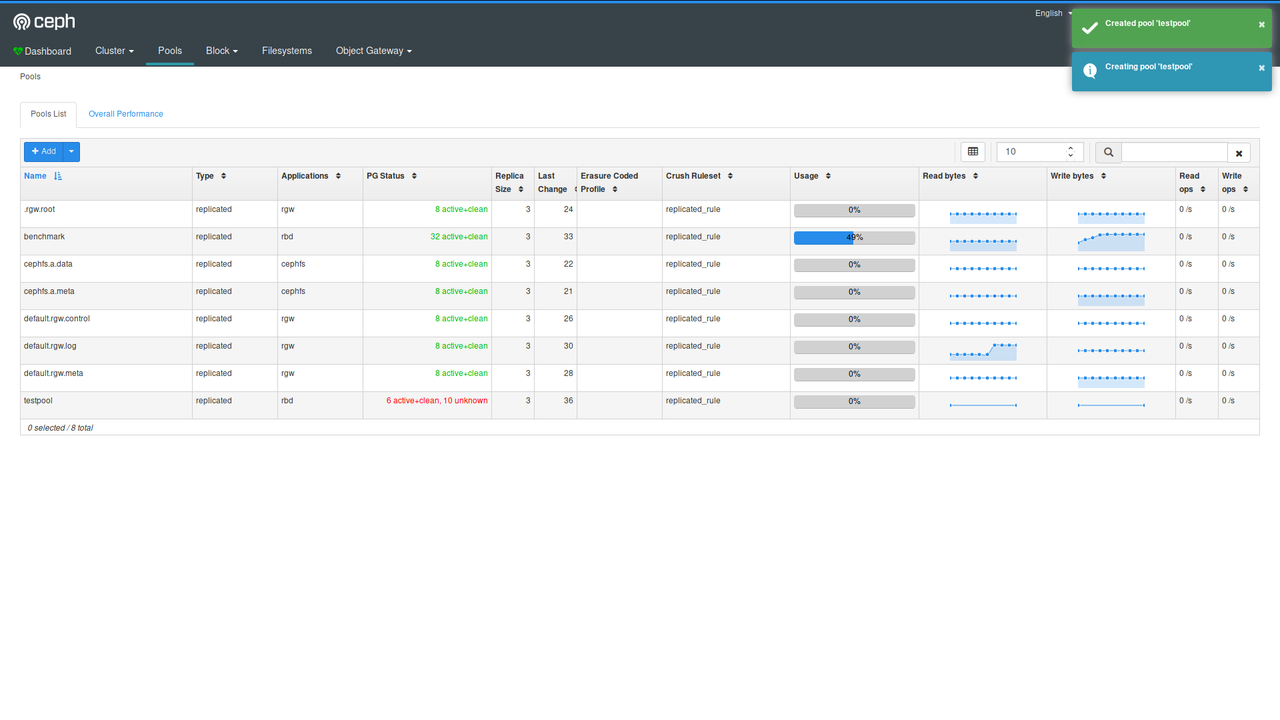
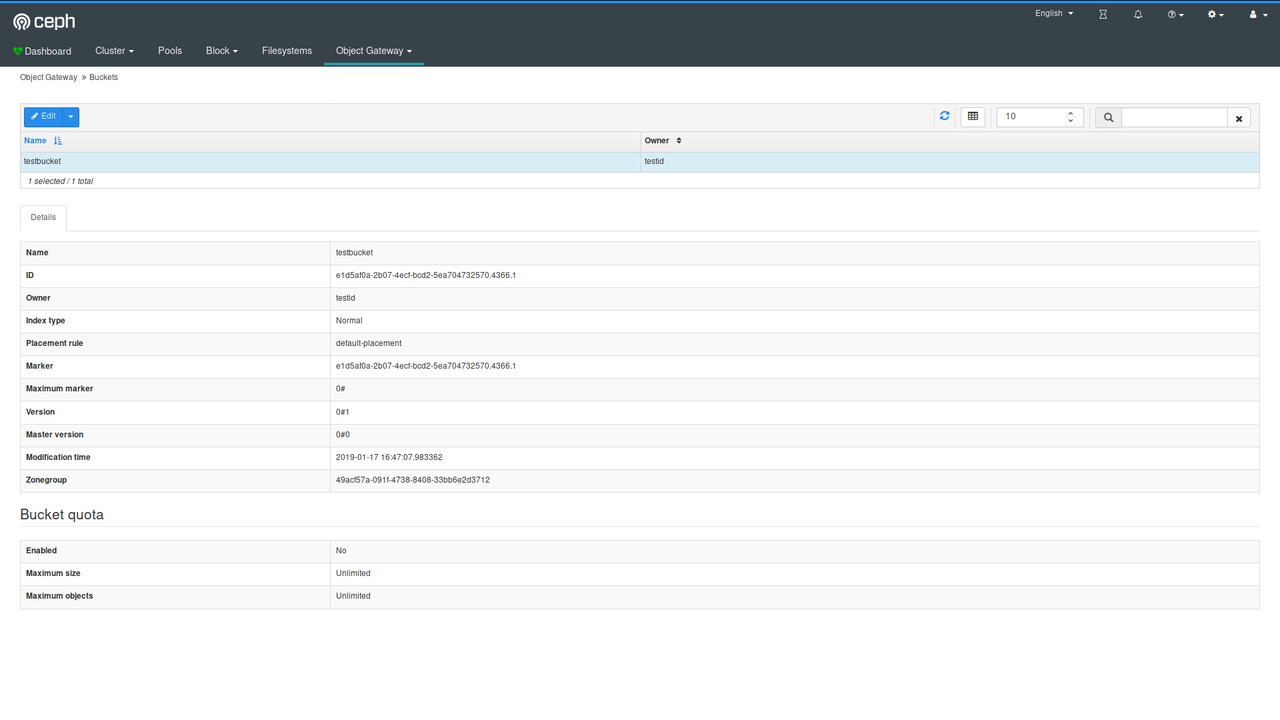
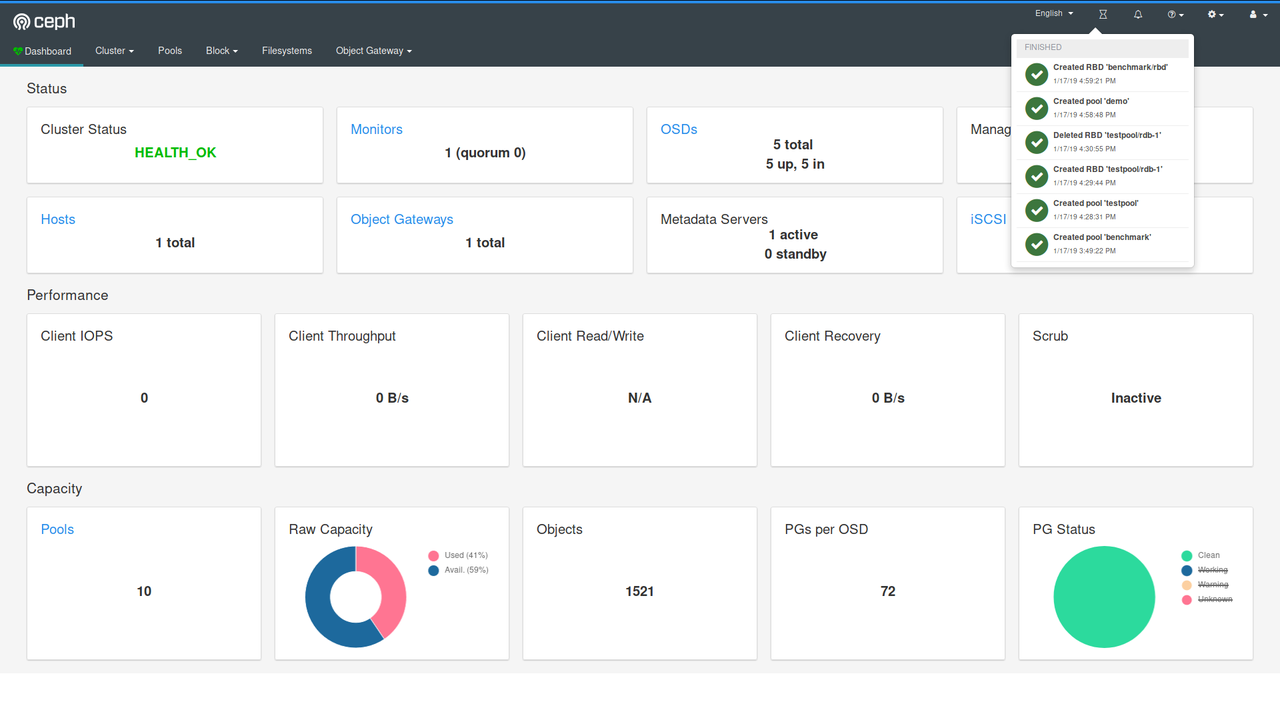
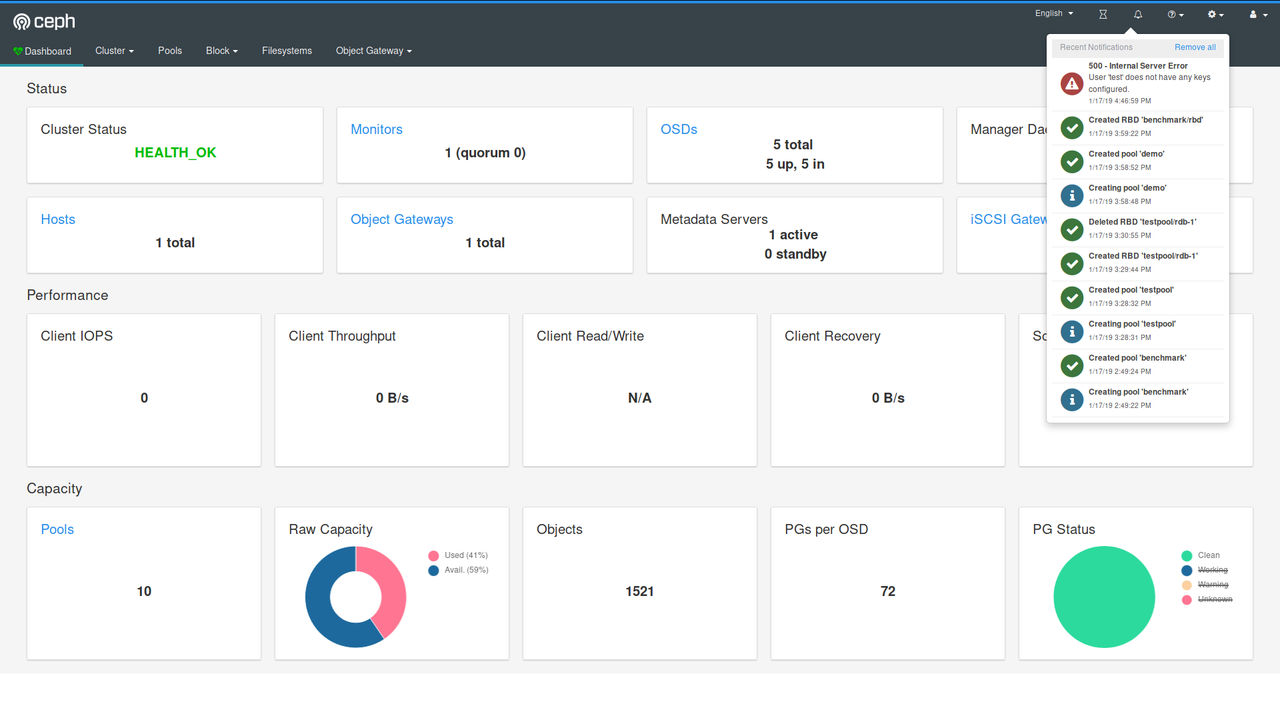
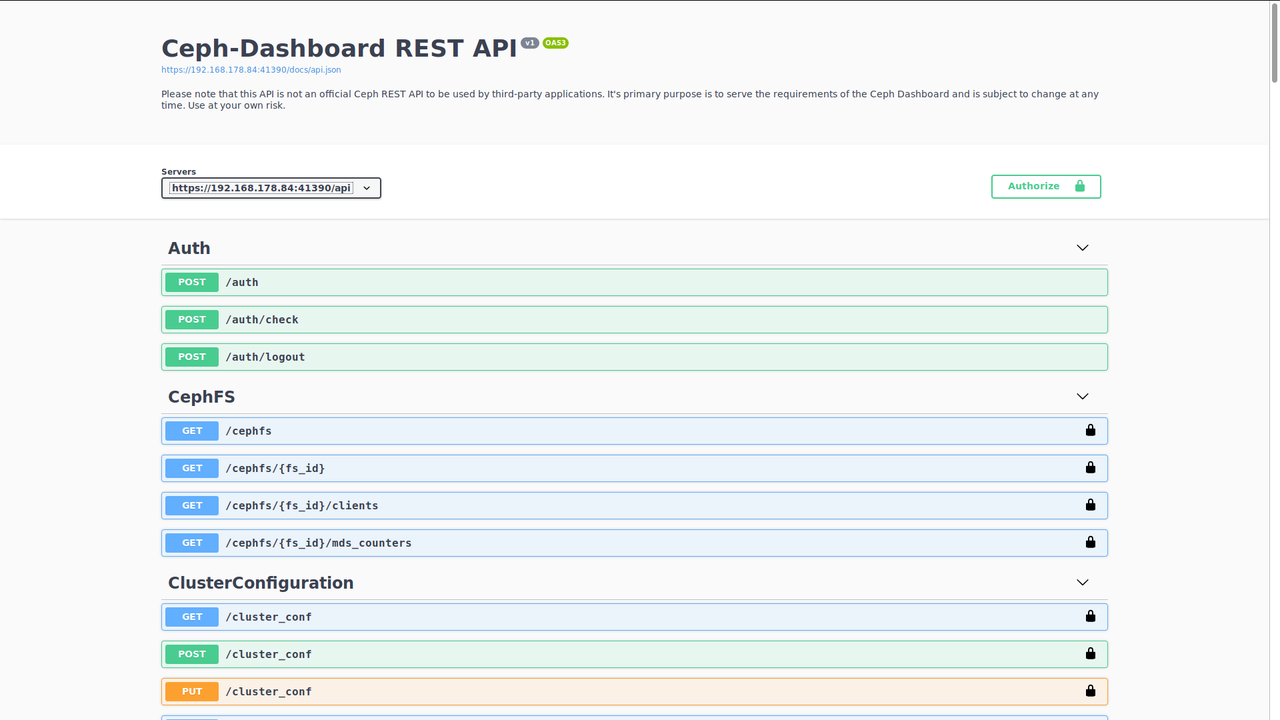
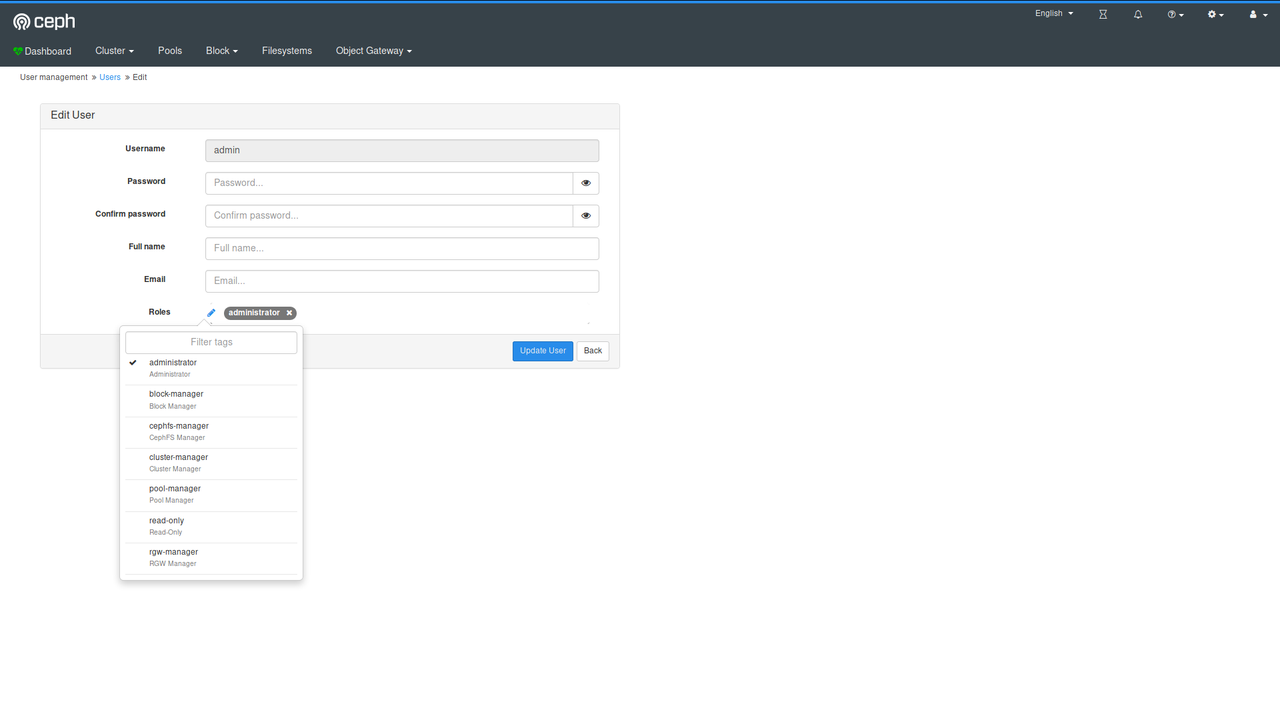
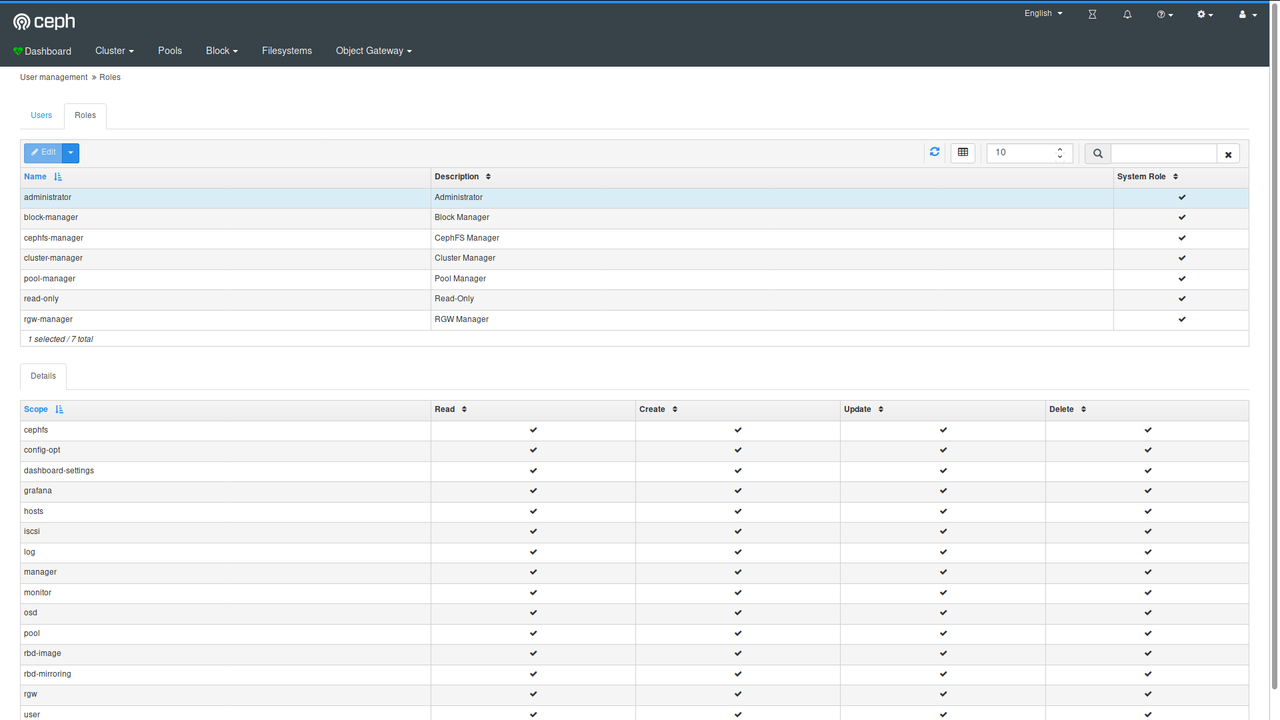
Ceph Manager Dashboard Screenshots as of 2019-01-17
A lot has happened since I last wrote about the Ceph Manager Dashboard on this blog. This project has grown significantly in several ways since then: lots of new features were added in preparation for the upcoming Ceph "Nautilus" release, and the team working on this project has also grown quite noticeably.
I'll be talking about this journey in more detail at the upcoming DevConf.CZ and FOSDEM conferences and upcoming blog posts, but I'd like to share some screenshots as teasers for the time being - enjoy!
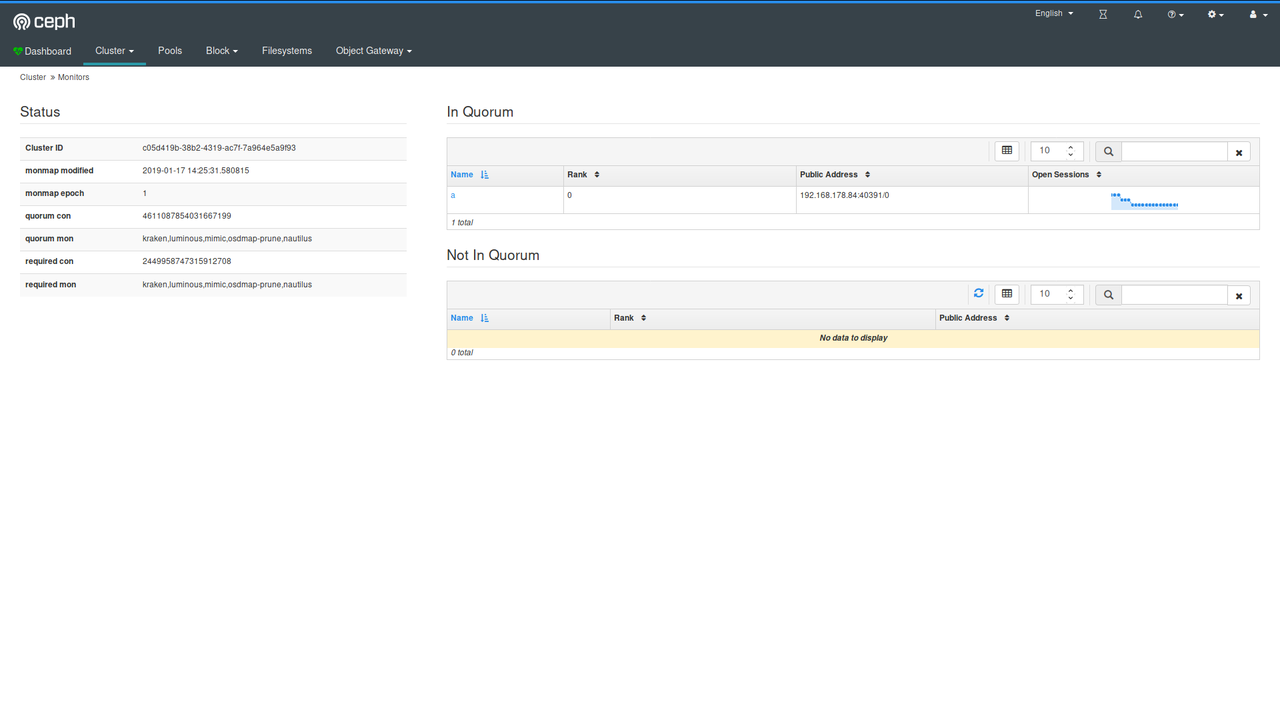
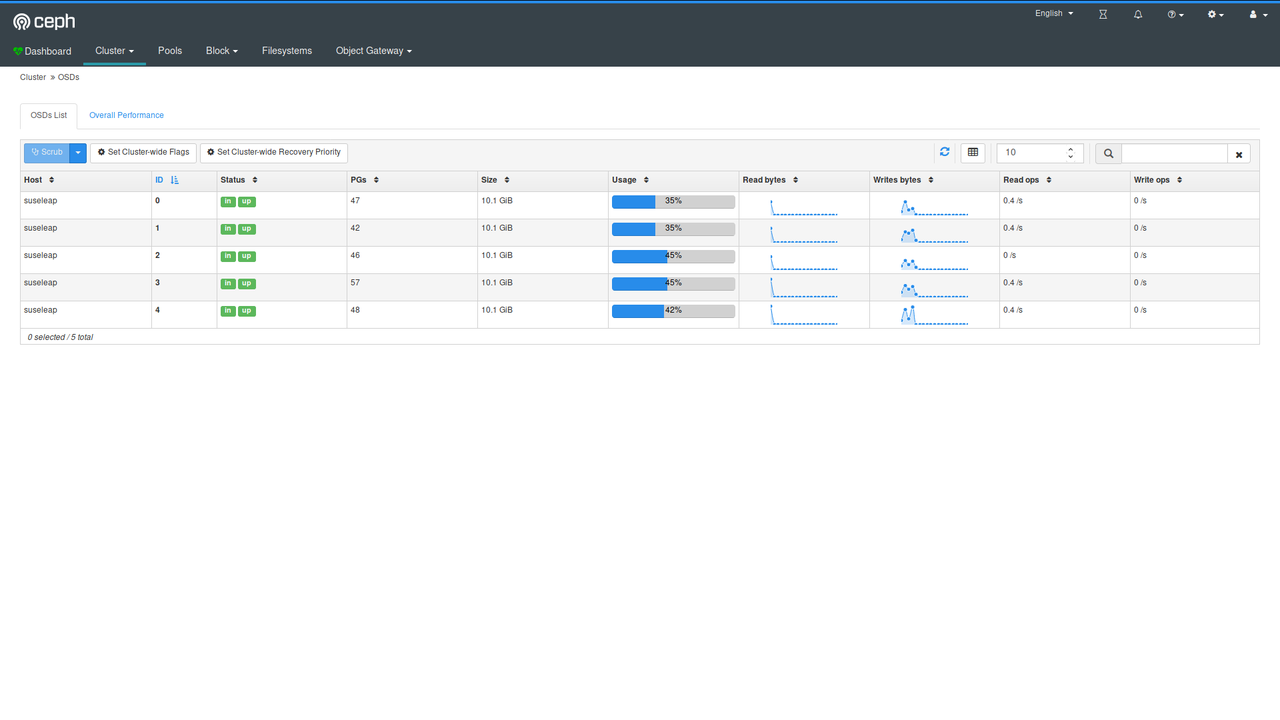
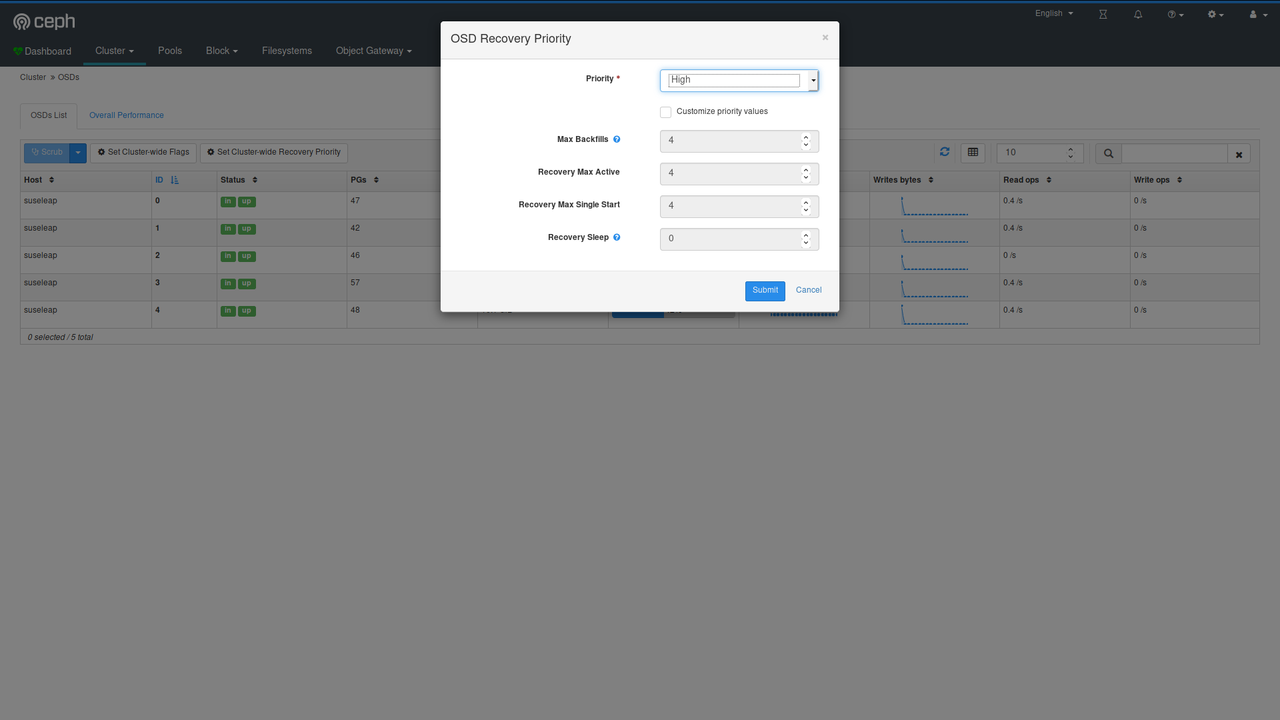
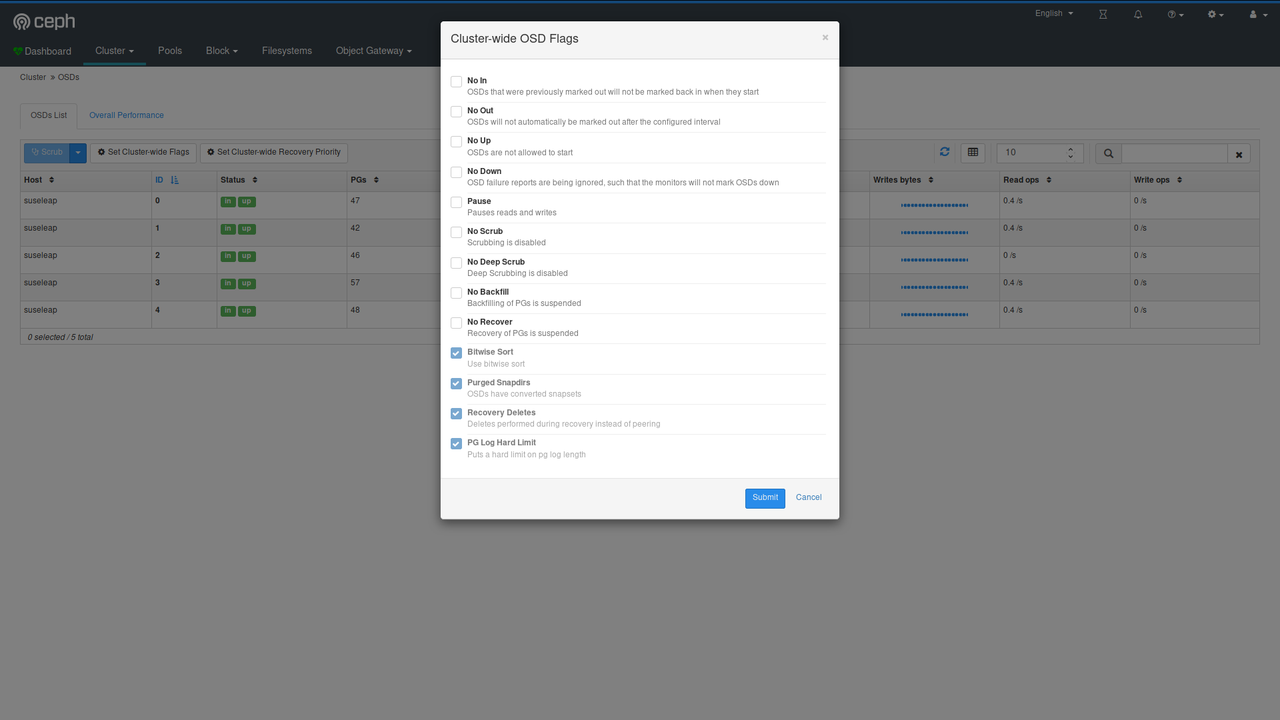
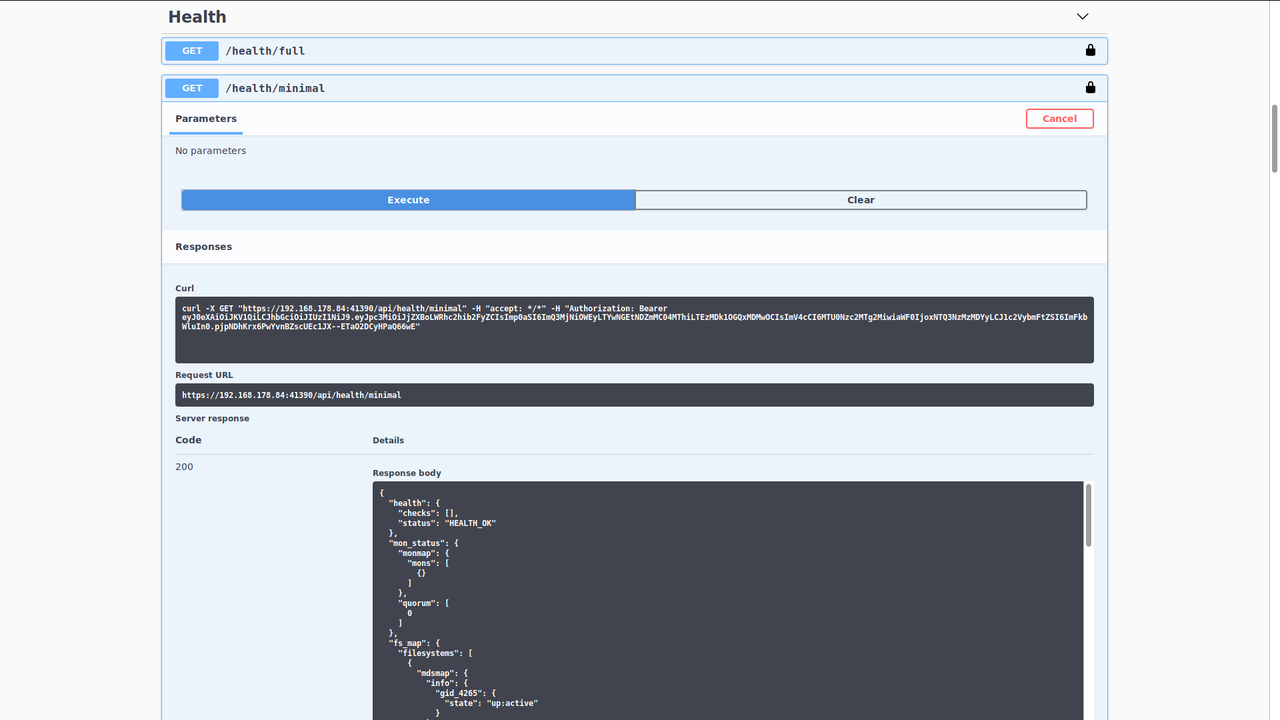
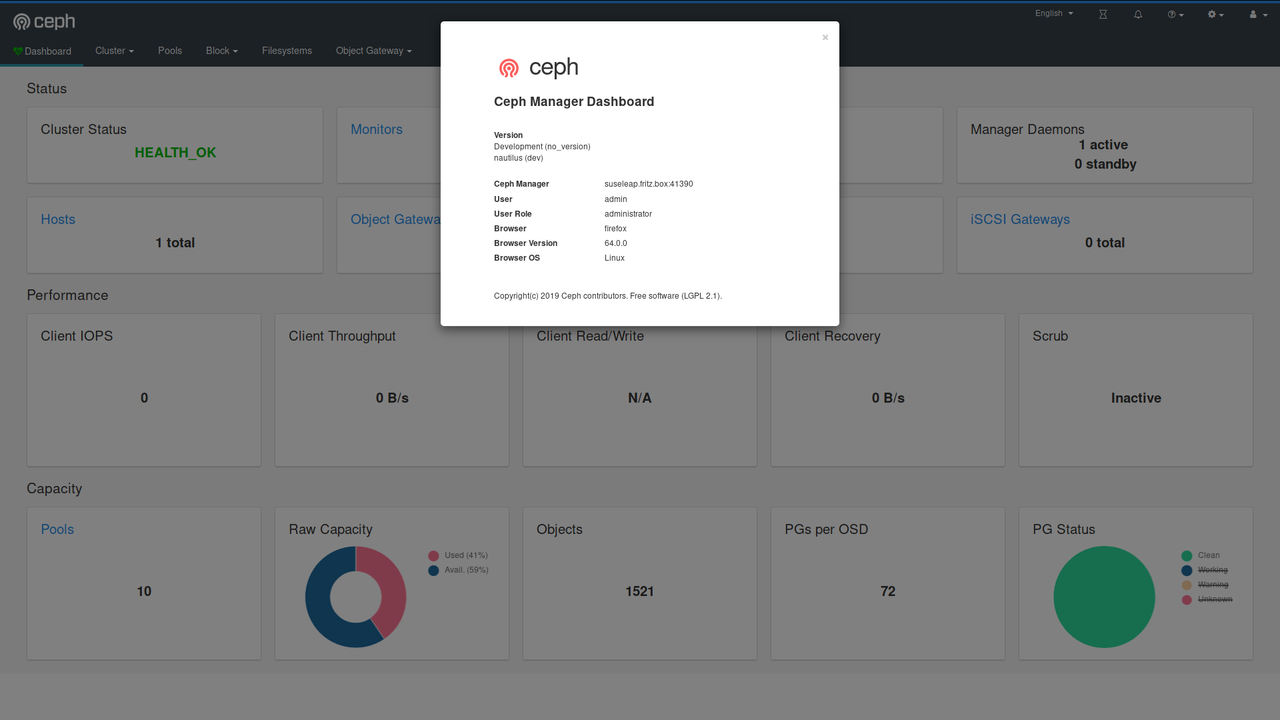
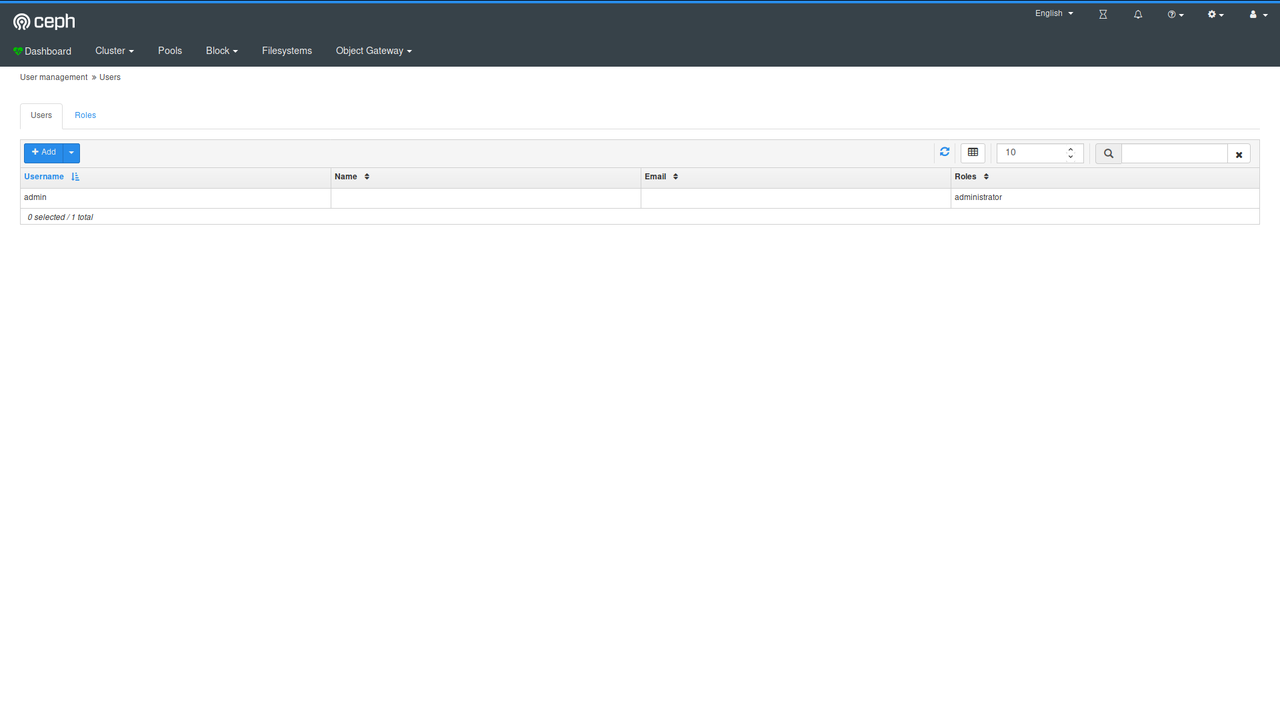
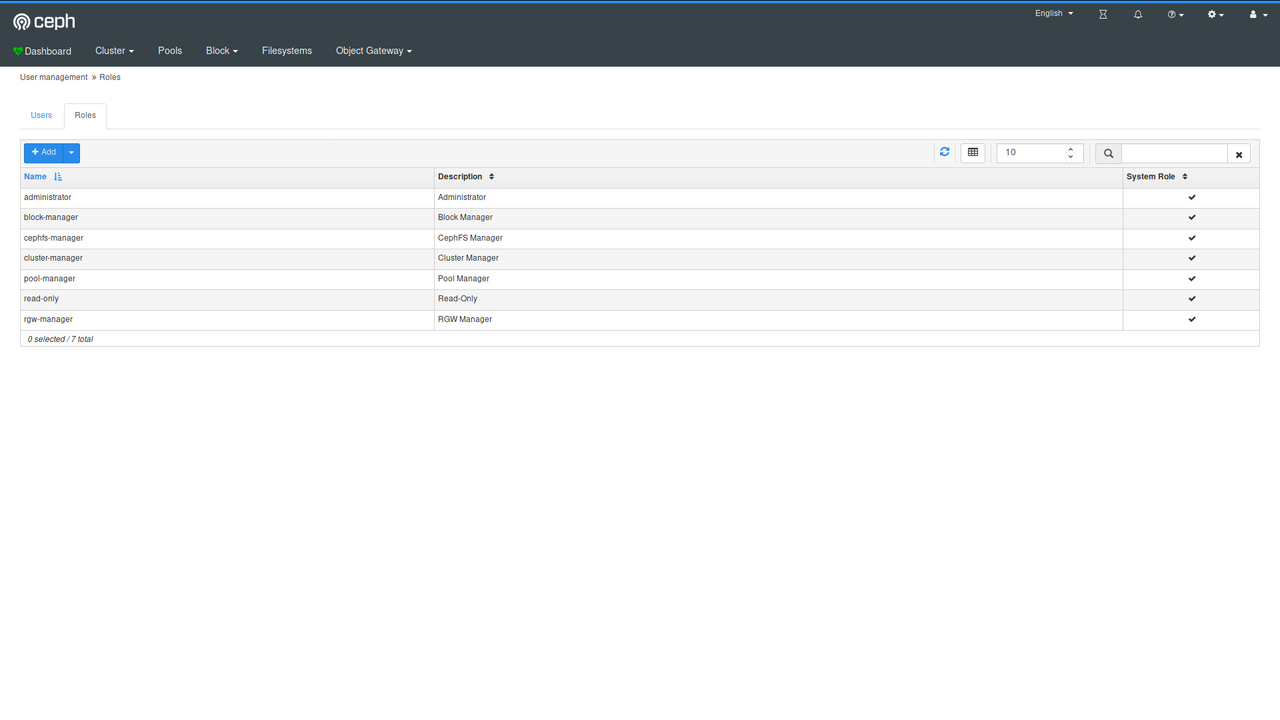
Note that these are made from a current development snapshot, the final version will likely look slightly different in some places. These screenshots also don't show the embedded Grafana dashboards and have been taken on a single node development system, so they aren't that impressive.
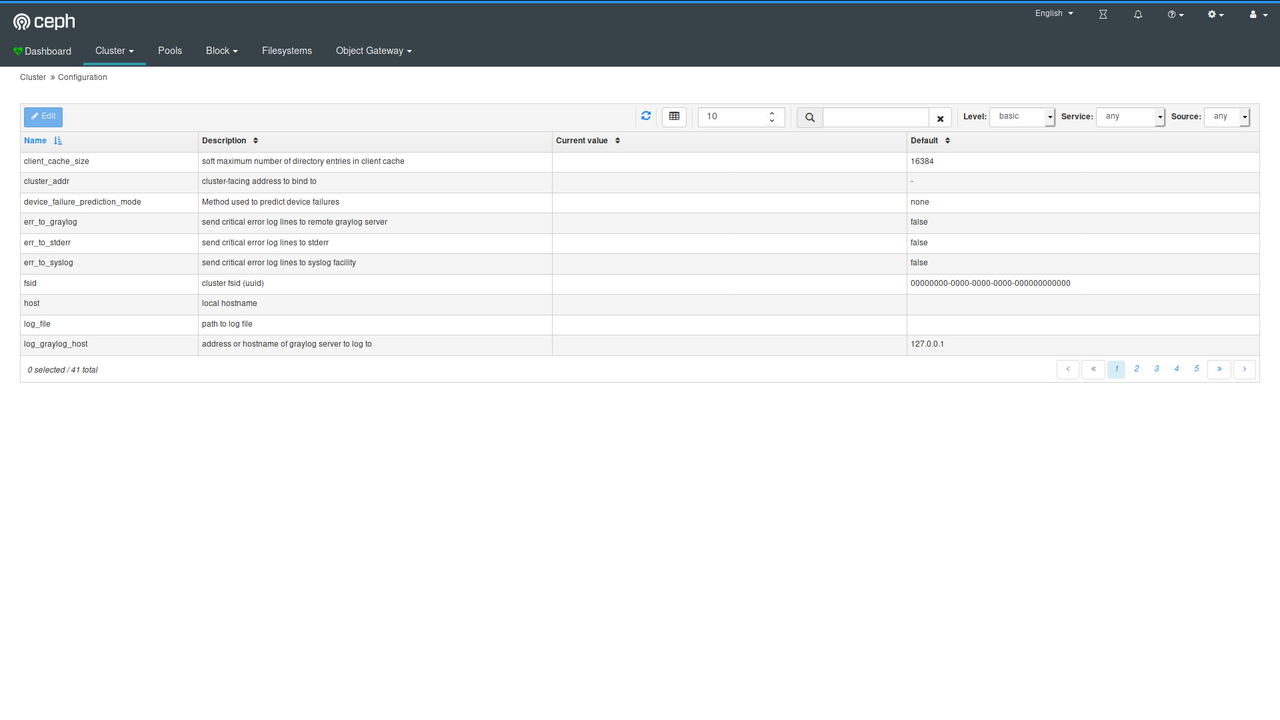
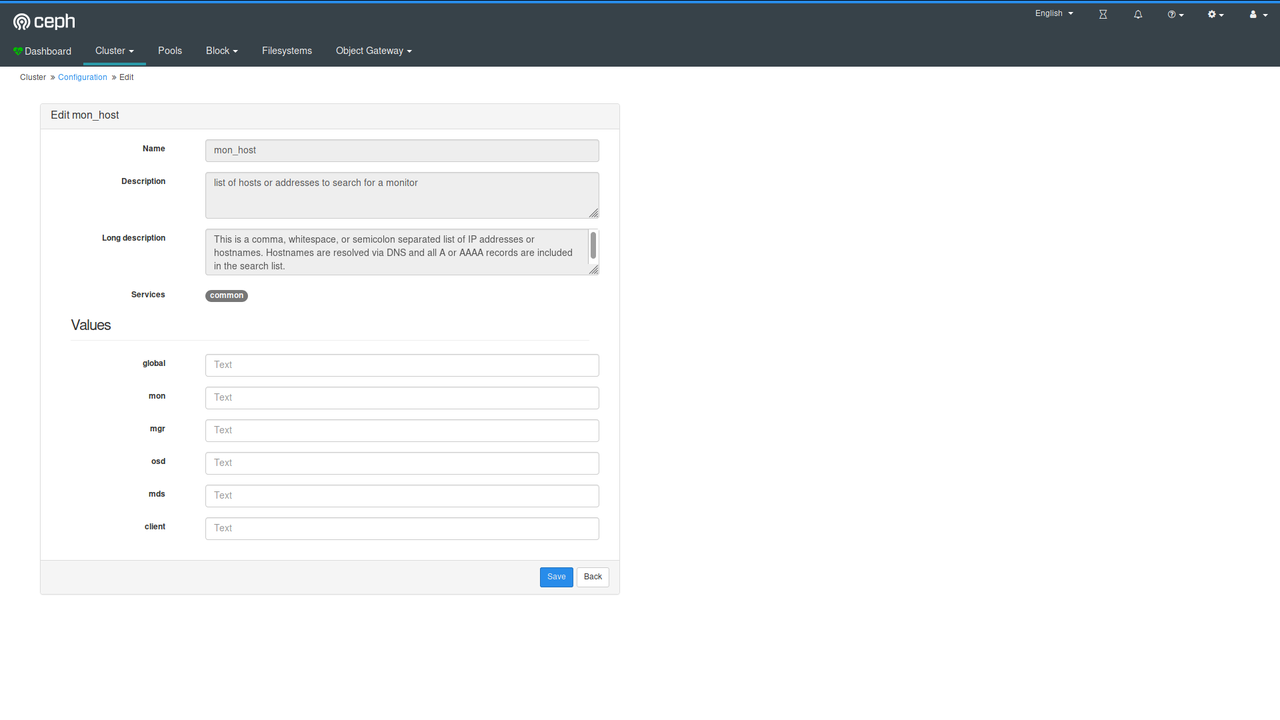
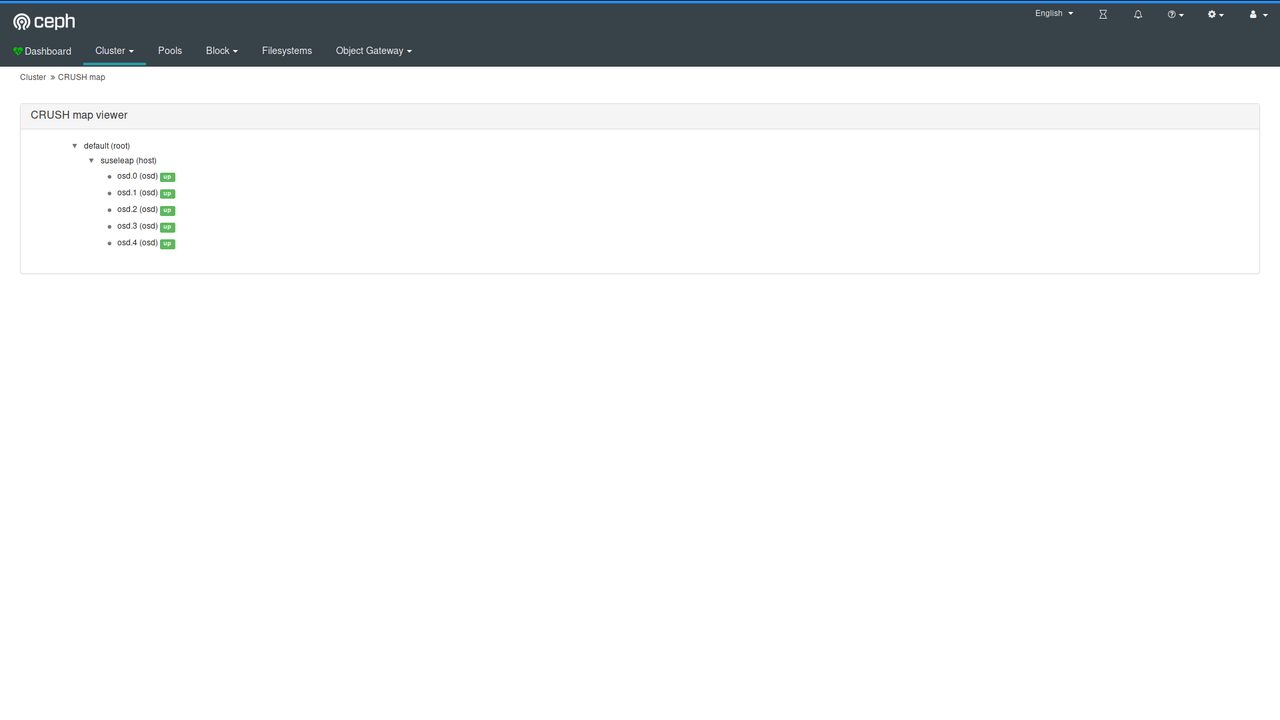
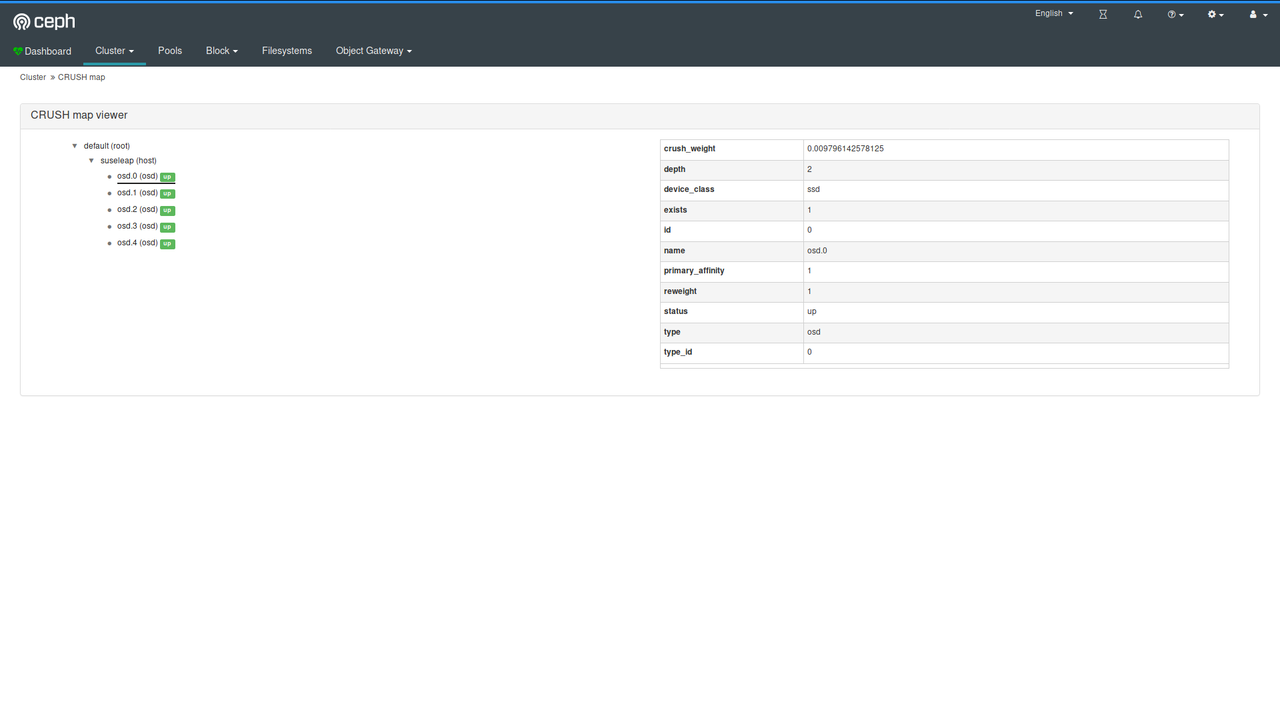
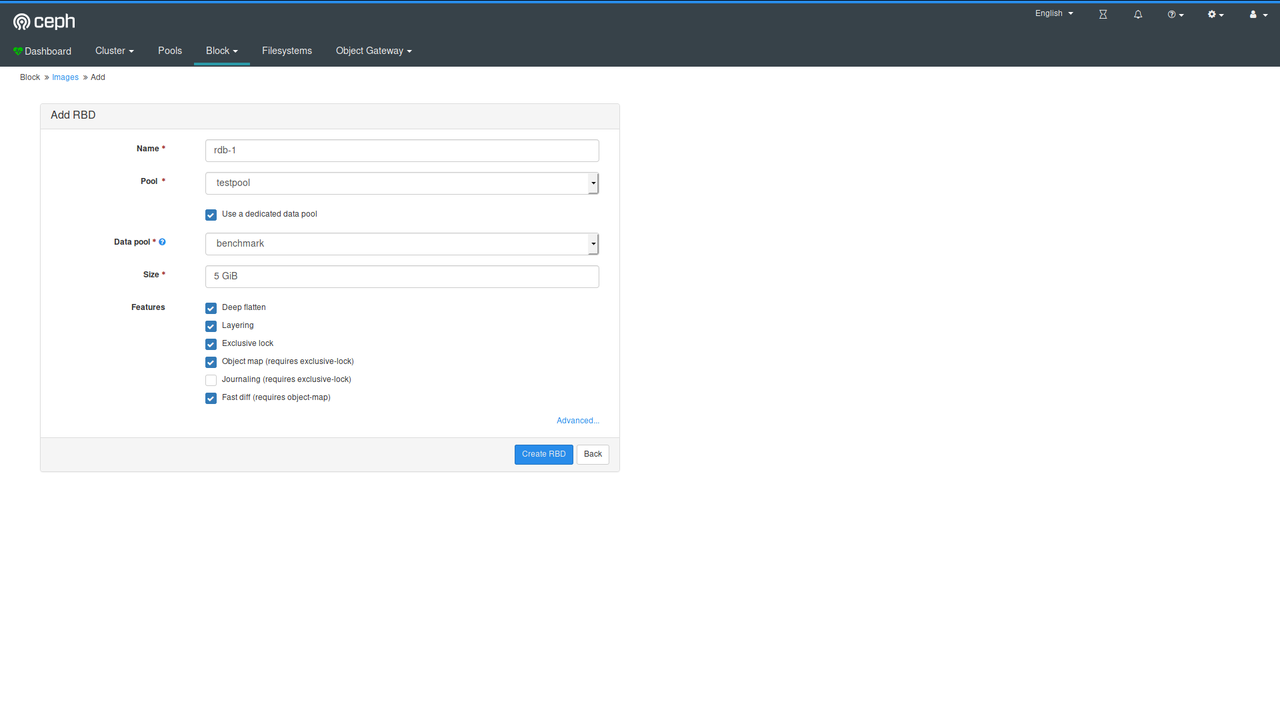
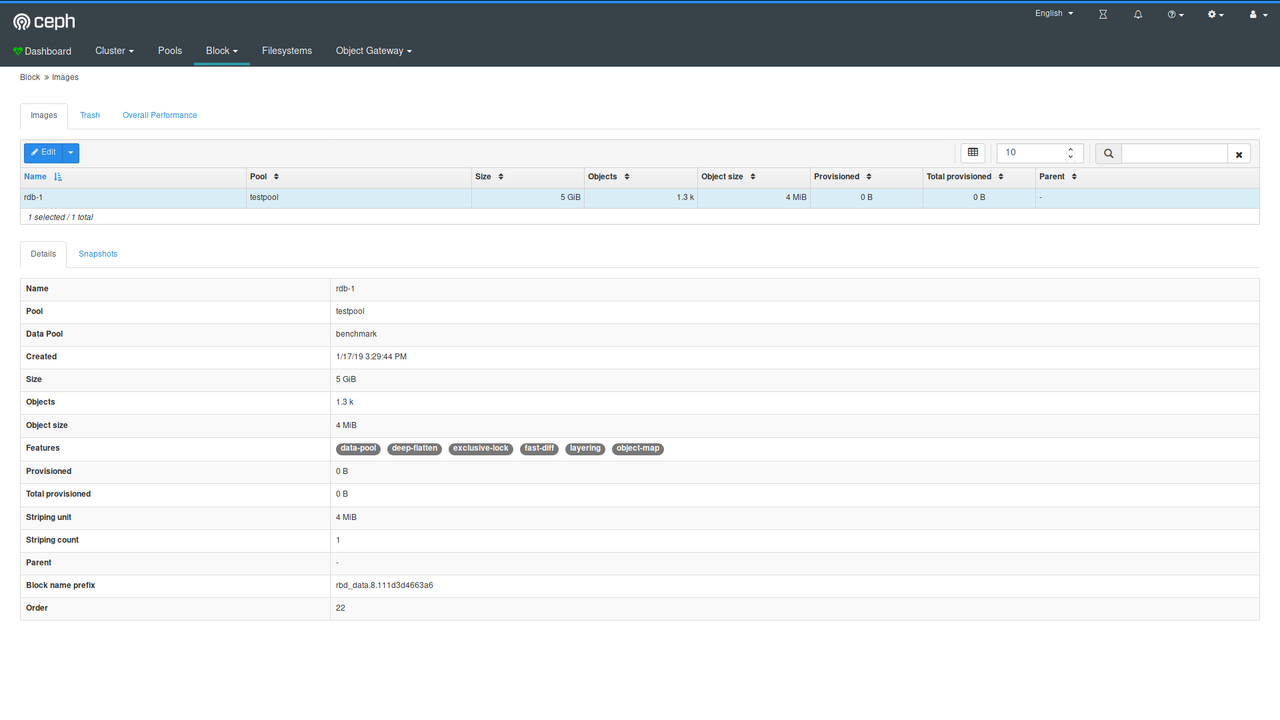
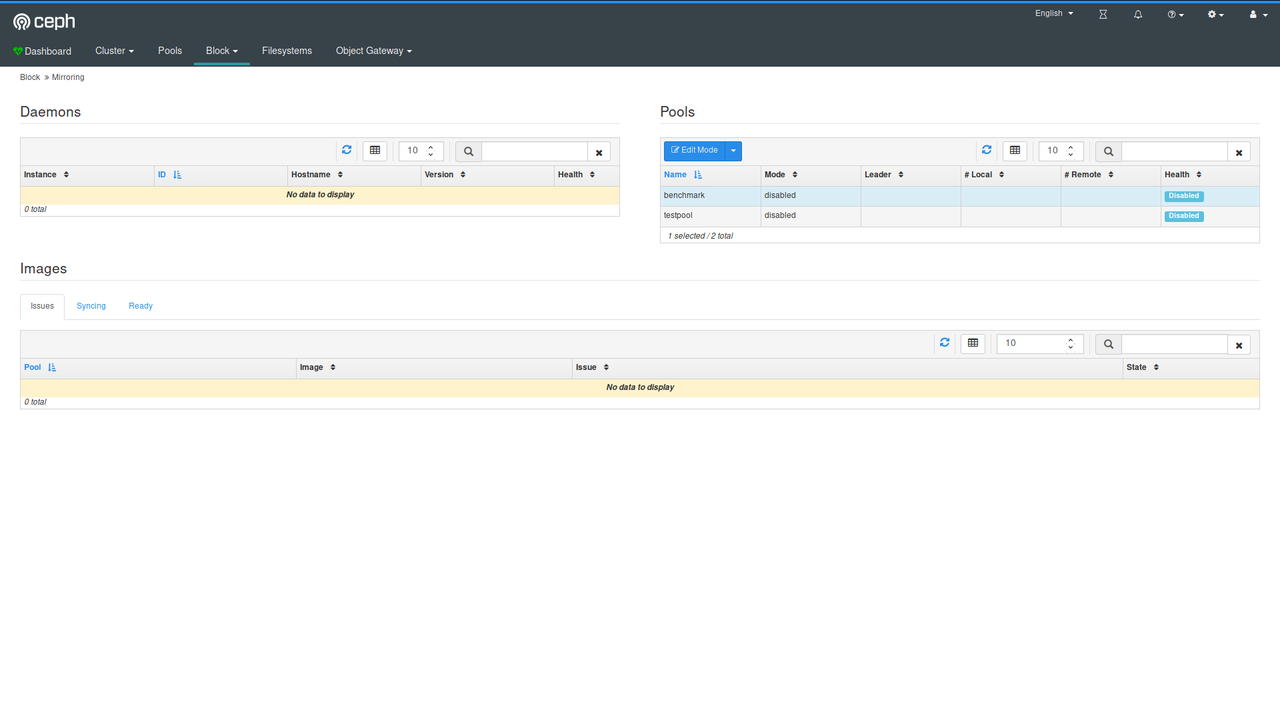
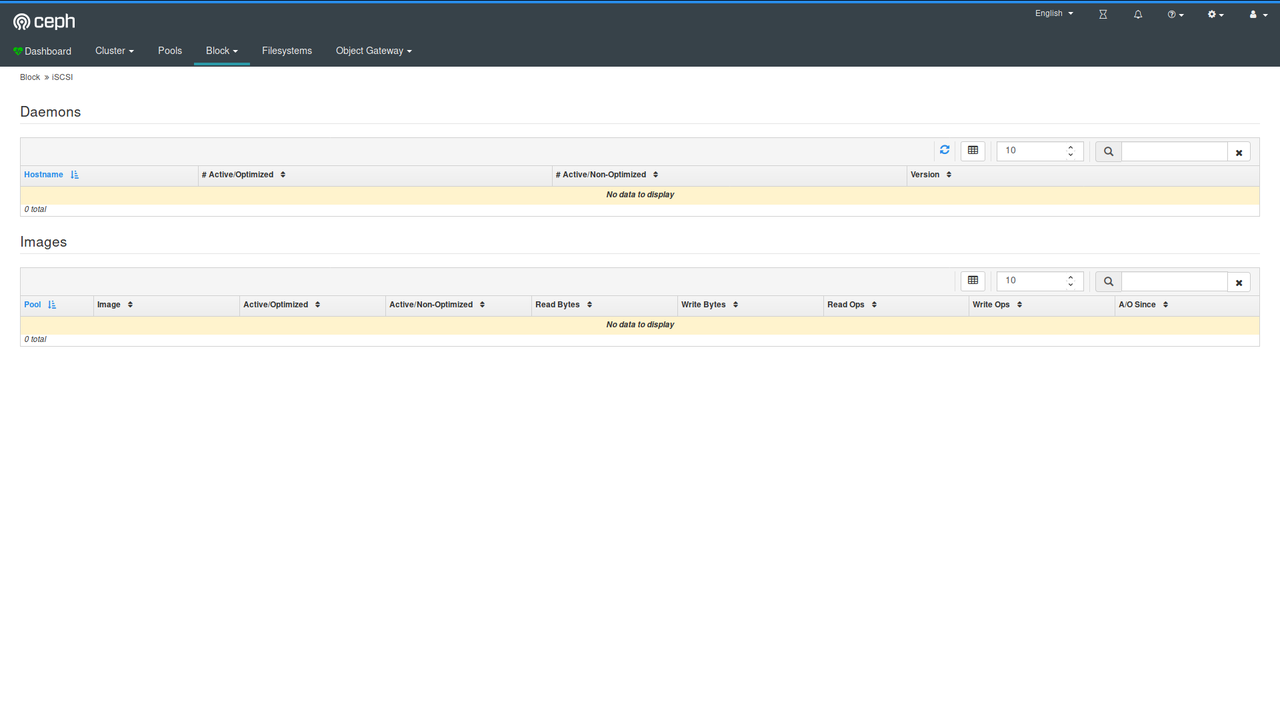
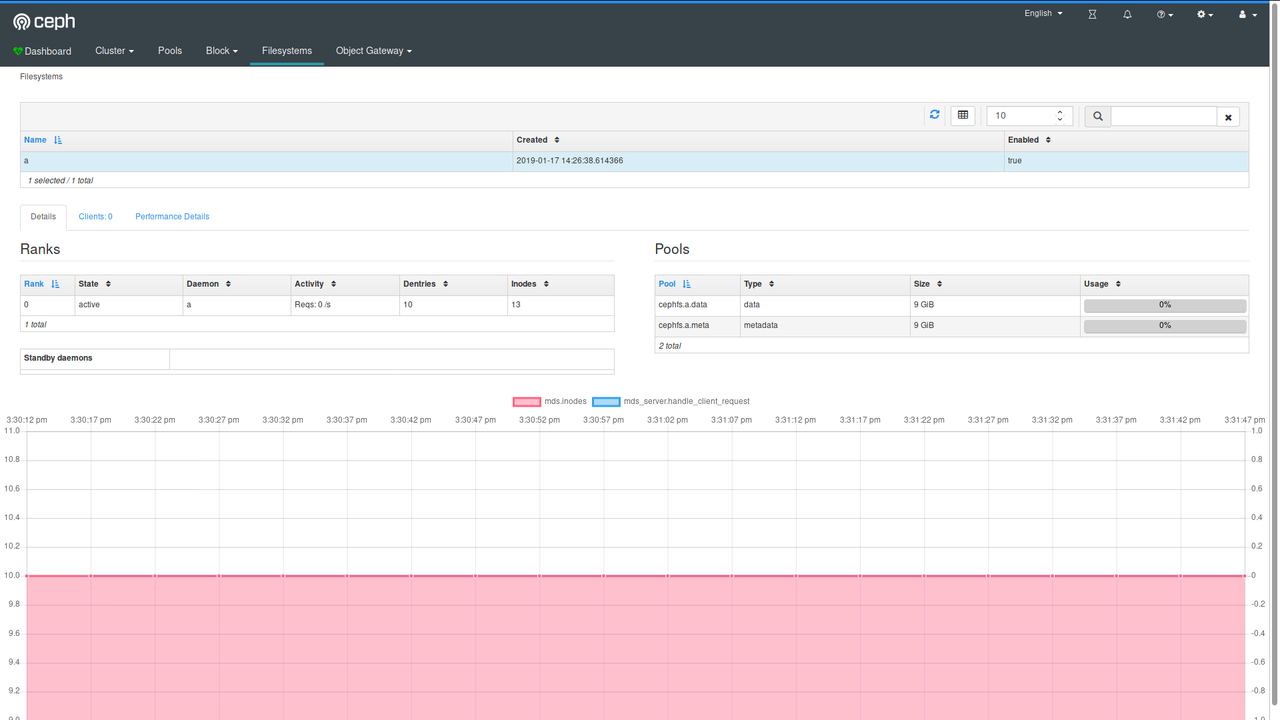
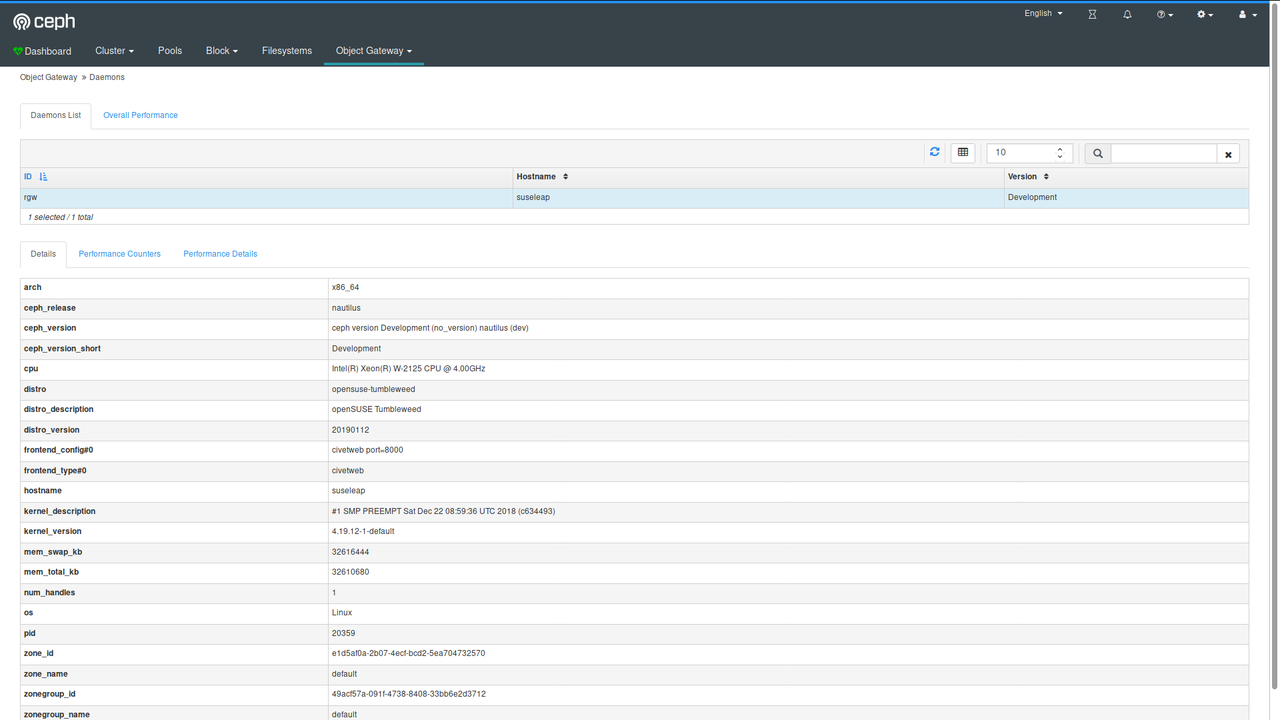
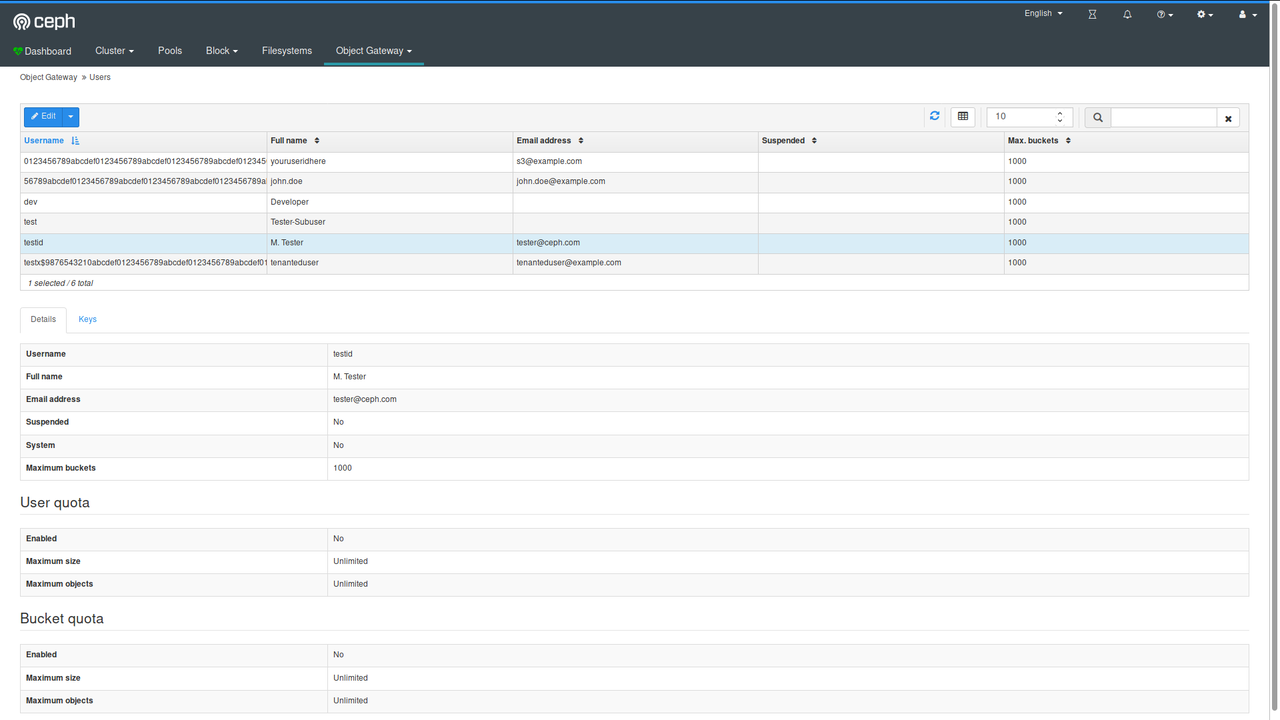
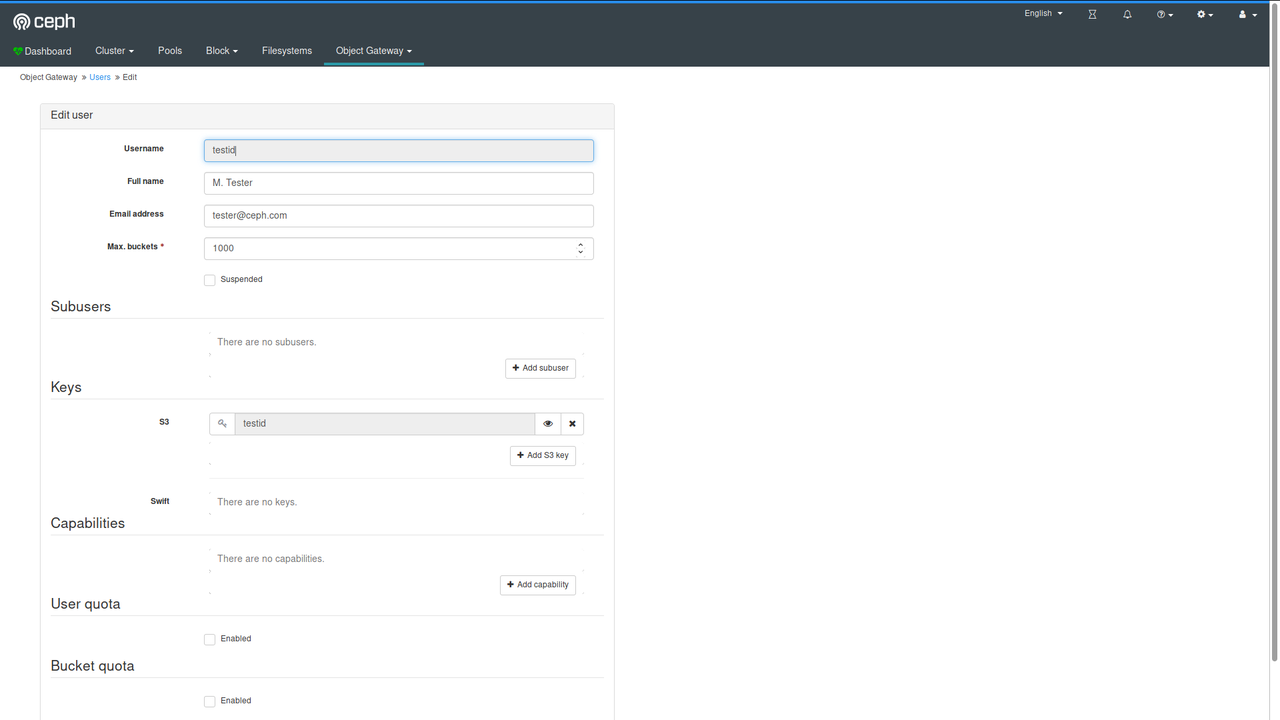
(See the gallery for higher resolution images)
Comments
Comments powered by Disqus