The Ceph Dashboard v2 pull request is ready for review!
About a month ago, we shared the news that we started working on a replacement for the Ceph dashboard, to set the stage for creating a full-fledged, built-in web-base management tool for Ceph.
We're happy to announce that we have now finalized the preparations for the initial pull request, which marks our first milestone in this venture: reaching feature parity with the existing dashboard.
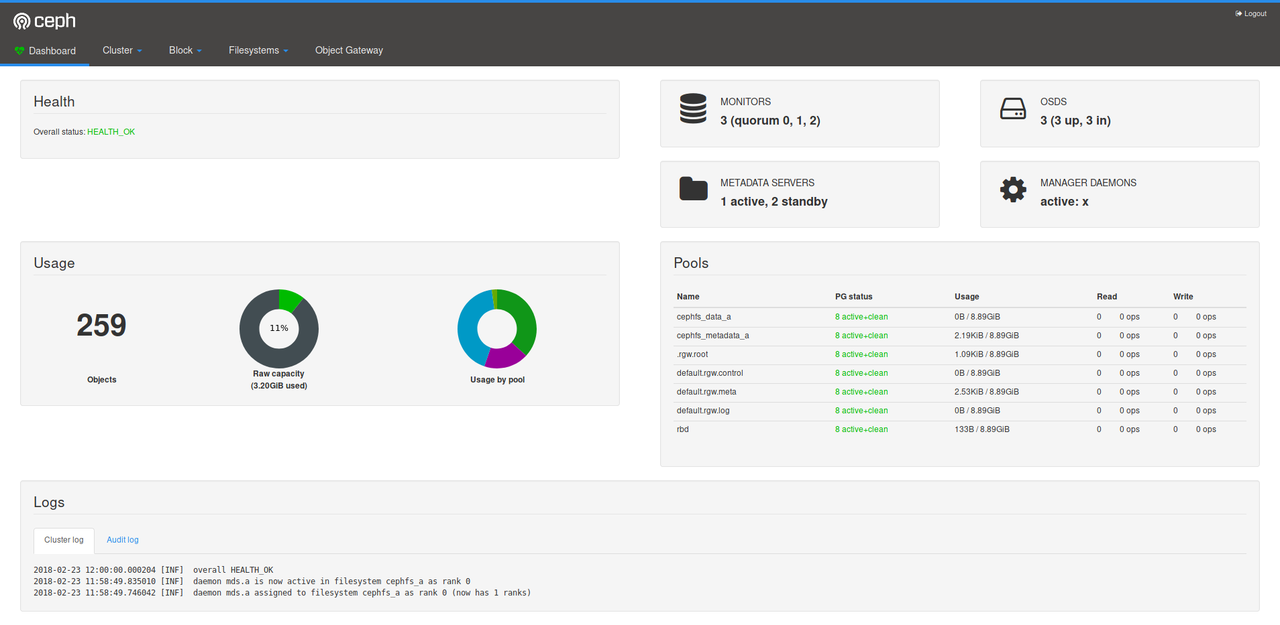
Screen shot of the Ceph health dashboard
In fact, compared to the dashboard shipped with Ceph Luminous, we already included a number of additional features that were added after the Luminous release and added a simple authentication mechanism.
Dashboard v2 currently provides insight into the following aspects of your Ceph cluster:
- Overall cluster health: Displays the overall cluster status, storage utilization (e.g. number of objects, raw capacity, usage per pool), a list of pools and their status and usage statistics, access to the cluster log file.
- Hosts: A list of all hosts associated to the cluster, which services are running and which version of Ceph is installed.
- Performance counters: Display detailed statistics for each running service.
- Monitors: List of all MONs, their quorum status, open sessions.
- Configuration Reference: List of all available configuration options, their description and default values.
- OSDs: A list of all OSDs, their status and usage statistics as well as detailed information like attributes (OSD map), metadata, performance counters and usage histograms for read/write operations.
- iSCSI: List of all hosts that run the TCMU runner service, list of all images and their performance characteristics (read/write ops, traffic).
- RBD: List of all RBD images and their properties (size, objects, features) in a given pool.
- RBD mirroring: List of all active sync daemons and their status, pools and RBD images including their synchronization state.
- CephFS: List of all active filesystem clients and associated pools, including their usage statistics.
- Object Gateway: List of all active object gateways and their performance counters.
You can see some screen shots of the new UI in our gallery.
We're looking forward to your feedback and comments!
Comments
Comments powered by Disqus